Sujet résolu
L'auteur a trouvé une solution à son problème.


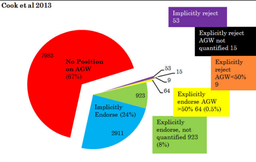
De plus, fait intéressant, il faut savoir qu'il existe un examen détaillé de Cook et al qui révèle en effet que 64 articles seulement sur plus de 12 000 approuvent de manière explicite la déclaration de l'AGW selon laquelle l'activité humaine, les émissions humaines seraient plus de 50% responsables du réchauffement climatique durant la période récente.
Batman sera toujours là pour faire régner la justice sur les topics de onche.
il y a 3 ans
Sponsorisé
Connectez-vous pour masquer les pubsSur l'étude de Cook, une bonne explication détaillée est donné par Thierry Baudet.
 https://rumble.com/vsp7r9[...]mat-retour-la-raison.html
Batman sera toujours là pour faire régner la justice sur les topics de onche.
il y a 3 ans
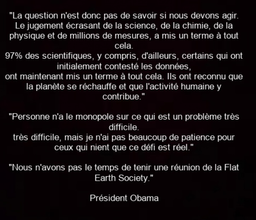
A Georgetown, en juin 2013, Obama, ancien présidents des US, disait ceci :
Parmi les autres mensonges de Barack Obama, voici un tweet très évocateur.
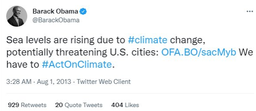
Petit rappel :
Parmi les autres mensonges de Barack Obama, voici un tweet très évocateur.
Petit rappel :
Batman sera toujours là pour faire régner la justice sur les topics de onche.
il y a 3 ans
Walter Lippmann disait :
"Là où tout le monde pense de la même façon, personne ne pense beaucoup."
Et là on est en plein dedans justement.
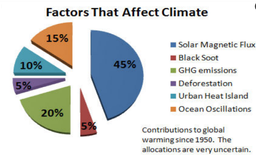
Dans un récent rapport du GIEC déclare : "Il est extrêmement probable que l'influence humaine soit la cause principale du réchauffement réchauffement observé depuis le milieu du 20e siècle". Et déclare : Cependant, ces déclarations ne décrivent pas ce qu'est l'influence humaine. En dépit de la revendication de certitude et de confiance élevée, en fait un nombre d'éléments affectent le changement climatique. Ceux-ci sont rarement
"Là où tout le monde pense de la même façon, personne ne pense beaucoup."
Et là on est en plein dedans justement.
Dans un récent rapport du GIEC déclare : "Il est extrêmement probable que l'influence humaine soit la cause principale du réchauffement réchauffement observé depuis le milieu du 20e siècle". Et déclare : Cependant, ces déclarations ne décrivent pas ce qu'est l'influence humaine. En dépit de la revendication de certitude et de confiance élevée, en fait un nombre d'éléments affectent le changement climatique. Ceux-ci sont rarement
Batman sera toujours là pour faire régner la justice sur les topics de onche.
il y a 3 ans
L'impact du CO2, issu de l'activité humaine, semble en fait, relativement faible par rapport aux autres facteurs.
Batman sera toujours là pour faire régner la justice sur les topics de onche.
il y a 3 ans
Qu'est ce qu'un consensus ?
un accord général sur quelque chose : une idée ou une opinion partagée par toutes les personnes d'un groupe.
Déjà, ce n'est pas la même chose que l'unanimité.
Il s'agit de ne pas se faire avoir par les mots.
Joyeeta Gupta déclarait ceci :
un accord général sur quelque chose : une idée ou une opinion partagée par toutes les personnes d'un groupe.
Déjà, ce n'est pas la même chose que l'unanimité.
Il s'agit de ne pas se faire avoir par les mots.
Joyeeta Gupta déclarait ceci :
Batman sera toujours là pour faire régner la justice sur les topics de onche.
il y a 3 ans
De plus, 97 articles ont décrit l'affirmation du chiffre de 97% d'accord comme étant merdique.
Ironique non?

 https://climatechangedisp[...]?utm_source=pocket_mylist

Ironique non?
Batman sera toujours là pour faire régner la justice sur les topics de onche.
il y a 3 ans
En ce qui concerne l'étude de Doran et Zimmerman.
Batman sera toujours là pour faire régner la justice sur les topics de onche.
il y a 3 ans
Dr. Roger Pielke explique très bien l'arnaque du consensus.
 https://friendsofscience.[...]nts/97_Consensus_Myth.pdf
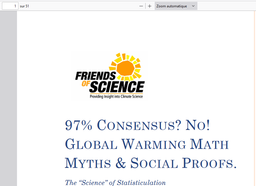
Plus de 50 pages au total de lecture. La page 13 est particulièrement intéressante à ce sujet néanmoins.

Plus de 50 pages au total de lecture. La page 13 est particulièrement intéressante à ce sujet néanmoins.
Batman sera toujours là pour faire régner la justice sur les topics de onche.
il y a 3 ans
Anthony_Agard
3 ans
Dr. Roger Pielke explique très bien l'arnaque du consensus.
https://friendsofscience.[...]nts/97_Consensus_Myth.pdf
Plus de 50 pages au total de lecture. La page 13 est particulièrement intéressante à ce sujet néanmoins.
Plus de 50 pages au total de lecture. La page 13 est particulièrement intéressante à ce sujet néanmoins.
Batman sera toujours là pour faire régner la justice sur les topics de onche.
il y a 3 ans
Sponsorisé
Connectez-vous pour masquer les pubs500 milliards de tonnes d'émissions représentant 14 % du total des émissions de CO2 d’origine humaine.
Et malgré cela, en bientôt une décennie, on ne constate point de réchauffement climatique.
Source : https://www.woodfortrees.[...]om:2016/to:2023/normalise
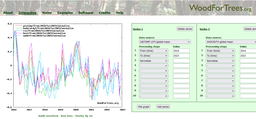
Et malgré cela, en bientôt une décennie, on ne constate point de réchauffement climatique.
Source :
Batman sera toujours là pour faire régner la justice sur les topics de onche.
il y a 3 ans
Pas étonnant qu'Enstein disait que les experts étaient des chiens dressés.

Batman sera toujours là pour faire régner la justice sur les topics de onche.
il y a 3 ans
L’hémisphère nord jusqu’en 2010 à partir de procurations (proxys) uniquement.
Source : https://www.sciencedirect[...]cle/pii/S1125786520300965 sur Science Direct sur le sujet : Prominent role of volcanism in Common Era climate variability and human history ;
publié par : Ulf Büntgen ; Dominique Arseneault ; Étienne Boucher ; Olga V. Churakova (Sidorova); Fabio Gennaretti; Alan Crivellaro; Hughes, Malcolm K; Alexander V. Kirdyanov; Lara Klippel; Paul J. Krusic ; Hans W. Linderholm ; Fredrik C. Ljungqvist ; Josef Ludescher; Michael McCormick; Vladimir S. Myglan; Kurt Nicolussi ; Alma Piermattei; Clive Oppenheimer; Frederick Reinig; Michael Sigl; Jan Esper
Publié en décembre 2020
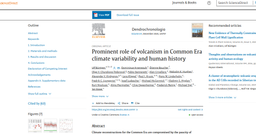
Il y a utilisation de données proxy.
Et des données proxy qui vont jusqu’aux années 2000 au lieu d’enlever les proxys post 1960 pour cacher certaines réalité dérangeantes et d’y mettre des instrumentaux,
Et donc ce cas précis, on constate que la hausse est inexistante.
Source :
publié par : Ulf Büntgen ; Dominique Arseneault ; Étienne Boucher ; Olga V. Churakova (Sidorova); Fabio Gennaretti; Alan Crivellaro; Hughes, Malcolm K; Alexander V. Kirdyanov; Lara Klippel; Paul J. Krusic ; Hans W. Linderholm ; Fredrik C. Ljungqvist ; Josef Ludescher; Michael McCormick; Vladimir S. Myglan; Kurt Nicolussi ; Alma Piermattei; Clive Oppenheimer; Frederick Reinig; Michael Sigl; Jan Esper
Publié en décembre 2020
Il y a utilisation de données proxy.
Et des données proxy qui vont jusqu’aux années 2000 au lieu d’enlever les proxys post 1960 pour cacher certaines réalité dérangeantes et d’y mettre des instrumentaux,
Et donc ce cas précis, on constate que la hausse est inexistante.
Batman sera toujours là pour faire régner la justice sur les topics de onche.
il y a 3 ans
Anthony_Agard
3 ans
L’hémisphère nord jusqu’en 2010 à partir de procurations (proxys) uniquement.
Source : https://www.sciencedirect[...]cle/pii/S1125786520300965 sur Science Direct sur le sujet : Prominent role of volcanism in Common Era climate variability and human history ;
publié par : Ulf Büntgen ; Dominique Arseneault ; Étienne Boucher ; Olga V. Churakova (Sidorova); Fabio Gennaretti; Alan Crivellaro; Hughes, Malcolm K; Alexander V. Kirdyanov; Lara Klippel; Paul J. Krusic ; Hans W. Linderholm ; Fredrik C. Ljungqvist ; Josef Ludescher; Michael McCormick; Vladimir S. Myglan; Kurt Nicolussi ; Alma Piermattei; Clive Oppenheimer; Frederick Reinig; Michael Sigl; Jan Esper
Publié en décembre 2020
Il y a utilisation de données proxy.
Et des données proxy qui vont jusqu’aux années 2000 au lieu d’enlever les proxys post 1960 pour cacher certaines réalité dérangeantes et d’y mettre des instrumentaux,
Et donc ce cas précis, on constate que la hausse est inexistante.
Source :
publié par : Ulf Büntgen ; Dominique Arseneault ; Étienne Boucher ; Olga V. Churakova (Sidorova); Fabio Gennaretti; Alan Crivellaro; Hughes, Malcolm K; Alexander V. Kirdyanov; Lara Klippel; Paul J. Krusic ; Hans W. Linderholm ; Fredrik C. Ljungqvist ; Josef Ludescher; Michael McCormick; Vladimir S. Myglan; Kurt Nicolussi ; Alma Piermattei; Clive Oppenheimer; Frederick Reinig; Michael Sigl; Jan Esper
Publié en décembre 2020
Il y a utilisation de données proxy.
Et des données proxy qui vont jusqu’aux années 2000 au lieu d’enlever les proxys post 1960 pour cacher certaines réalité dérangeantes et d’y mettre des instrumentaux,
Et donc ce cas précis, on constate que la hausse est inexistante.
Batman sera toujours là pour faire régner la justice sur les topics de onche.
il y a 3 ans
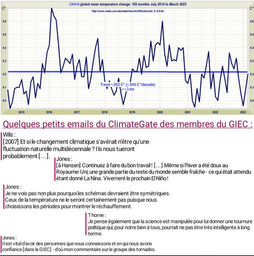
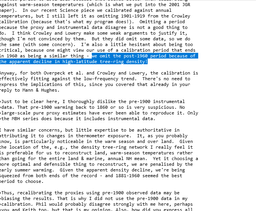
Pour revenir sur le GIEC, regardons du côté d'une fraude, un certain Timothy Osborn,auteur principal du 5ème rapport du GIEC puis rédacteur en chef d’un chapitre du 6ème.
 https://web.archive.org/w[...]ia/foia2011/mail/1546.txt
cc: [email protected]
date: Fri, 12 Apr 2002 12:16:57 +0100
from: Tim Osborn <[email protected]>
subject: Re: Fwd: RE: Recent NH reconstruction
to: Edward Cook <[email protected]>
<x-flowed>
At 12:55 08/04/02, Edward Cook wrote:
>Some quick questions, comments, and a request. First, when you say that
>you recalibrated all of the series shown in your windy perspectives bit,
>what time period did you recalibrate all the series over?
1881-1960.
>Was it the same for all series?
Exceptions (as mentioned in Briffa et al., 2001, JGR paper on our
age-banded reconstructions) are:
(1) because Overpeck et al. provided only 5-yr mean values, the
instrumental data were converted to matching 5-yr means.
(2) because Crowley and Lowery's series had reduced high-frequency
variability (due to their use of some lower-resolution proxies, and the way
they combined these with the higher-resolution ones), the instrumental data
were smoothed with a decadal filter. Plus we omitted the period 1901-1919
from the calibration. Crowley and Lowery omitted a similar (perhaps a bit
longer?) period when they did their calibration. I shortened and moved the
omitted period to 1901-1919 because that seemed better when calibrating
against warm-season temperatures (which is what we put into the 2001 JGR
paper). In our recent Science piece we calibrated against annual
temperatures, but I still left it as omitting 1901-1919 from the Crowley
calibration (because that's what my program does!). Omitting a period
because the proxy and instrumental data disagree is not a good thing to
do. I think Crowley and Lowery make some weak arguments to justify it,
though I'm not convinced by them. But they did omit some data, so we do
the same (with some concern). I'm also a little hesitant about being too
critical, because one might view our use of a calibration period that ends
in 1960 as being a similar thing - we omit the post-1960 period because of
the apparent decline in high-latitude tree-ring density!
Anyway, for both Overpeck et al. and Crowley and Lowery, the calibration is
effectively fitting against the low-frequency trend. There's no need to
express the implications of this, since you covered that already in your
reply to Mann & Hughes.
>Just to be clear here, I thoroughly dislike the pre-1900 instrumental
>data. That pre-1900 warming back to 1860 or so is very suspicious. No
>large-scale pure proxy estimates have ever been able to reproduce it. Only
>the MBH series does because it includes instrumental data.
I have similar concerns, but little expertise to be authoritative in
attributing it to changes in thermometer exposure. It, as you probably
know, is particularly noticeable in the warm season and over land. Given
the location of the, e.g., the density tree-ring network I really feel it
is preferable for us to reconstruct land, warm-season temperatures rather
than going for the entire land & marine, annual NH mean. Yet it choosing a
more optimal and defensible thing to reconstruct, we are penalised by the
early summer warming. Given the apparent density decline, we're being
squeezed from both ends of the record - and 1881-1960 seemed the best
period to choose.
>Thus, recalibrating the proxies using pre-1900 observed data may be
>biasing the results. That is why I did not use the pre-1900 data in my
>calibration. Phil would probably disagree strongly with me here, perhaps
>you and Keith too, but that is my opinion. Also, how did you express all
>series as anomalies from the observed 1961-1990 mean when not all series
>extended out to 1990 (e.g. Briffa1, Mann)?
I haven't checked, but I'd guess that *none* of the calibrated series have
a zero mean over 1961-1990. But their mean over the calibration period
(1881-1960, except for Crowley & Lowery - see above) will be forced by
calibration to match the mean of the instrumental temperatures over the
same period. Since the instrumental temperatures are expressed as deg C
anomalies from the 1961-90 mean, the calibrated reconstructions have the
same units.
>I honestly dislike such short anomaly periods in any case, especially when
>the data are trendy. It unnaturally distorts the visual expression of the
>data (my opinion anyway).
Yes - I've been playing around with calibrating the proxy records against
each other (rather than against instrumental data) over earlier and much
longer periods - it really highlights the similarity of the decadal-century
variability (in many cases due to the common proxy records, of course).
>Finally, can you send me the unfiltered observed land-only data that you used?
File is attached.
Best wishes
Tim
Batman sera toujours là pour faire régner la justice sur les topics de onche.
il y a 3 ans
David Deming avait dit : i had an interesting experience aroud the time my paper was published in science. I received an astonishing email from a major researcher in the area of climate change : He said : We have to get rid of the medieval warm period.
Source : https://www.ncpathinktank[...]ysteria-on-global-warming
Autres : https://www.researchgate.[...]rth_Fennoscandian_summers ; publié par : Håkan Grudd
(Swedish Polar Research Secretariat, Stockholm, Sweden, PhD) sur le sujet : Torneträsk tree-ring width and density AD 500–2004: a test of climatic sensitivity and a new 1500-year reconstruction of north Fennoscandian summers ;
et sa version pdf : file:///C:/Users/33601/Do[...]d_density_AD_500-2004.pdf
Egalement publié ici : http://www.diva-portal.or[...]va2:189270/FULLTEXT01.pdf
michael mann used my data series but he inserted it upside down : prof andy baker Source : https://climateaudit.org/[...]e-peerreviewedliterature/
Source :
Autres :
(Swedish Polar Research Secretariat, Stockholm, Sweden, PhD) sur le sujet : Torneträsk tree-ring width and density AD 500–2004: a test of climatic sensitivity and a new 1500-year reconstruction of north Fennoscandian summers ;
et sa version pdf : file:///C:/Users/33601/Do[...]d_density_AD_500-2004.pdf
Egalement publié ici : http://www.diva-portal.or[...]va2:189270/FULLTEXT01.pdf
michael mann used my data series but he inserted it upside down : prof andy baker Source :
Batman sera toujours là pour faire régner la justice sur les topics de onche.
il y a 3 ans
Anthony_Agard
3 ans
David Deming avait dit : i had an interesting experience aroud the time my paper was published in science. I received an astonishing email from a major researcher in the area of climate change : He said : We have to get rid of the medieval warm period.
Source : https://www.ncpathinktank[...]ysteria-on-global-warming
Autres : https://www.researchgate.[...]rth_Fennoscandian_summers ; publié par : Håkan Grudd
(Swedish Polar Research Secretariat, Stockholm, Sweden, PhD) sur le sujet : Torneträsk tree-ring width and density AD 500–2004: a test of climatic sensitivity and a new 1500-year reconstruction of north Fennoscandian summers ;
et sa version pdf : file:///C:/Users/33601/Do[...]d_density_AD_500-2004.pdf
Egalement publié ici : http://www.diva-portal.or[...]va2:189270/FULLTEXT01.pdf
michael mann used my data series but he inserted it upside down : prof andy baker Source : https://climateaudit.org/[...]e-peerreviewedliterature/
Source :
Autres :
(Swedish Polar Research Secretariat, Stockholm, Sweden, PhD) sur le sujet : Torneträsk tree-ring width and density AD 500–2004: a test of climatic sensitivity and a new 1500-year reconstruction of north Fennoscandian summers ;
et sa version pdf : file:///C:/Users/33601/Do[...]d_density_AD_500-2004.pdf
Egalement publié ici : http://www.diva-portal.or[...]va2:189270/FULLTEXT01.pdf
michael mann used my data series but he inserted it upside down : prof andy baker Source :
Les pr richard muller pr mia tiljander pr henry pollack disent grosso modo la même chose sur Michael Mann.
Batman sera toujours là pour faire régner la justice sur les topics de onche.
il y a 3 ans
Le climat et le covid sont tous les deux été instrumentalisé pour la simple et bonne raison que tous deux ignorent les frontières. De quoi avancer de plus en plus dans la direction d'une direction mondiale et globale voulue par certains. Des sujets qui sont de nature transnationaux, c'est à dire que concrètement les nations prises isolément ne sauraient gérer puisqu’ils sont globaux, et qui commandent donc à celles-ci une coopération internationale dans des instances lesquelles, à la manière de la société civile et notamment les jeunes gens, ne peuvent que constater l’incapacité de nos dirigeants à s’entendre. Voilà la logique derrière tout cela. Le problème majeure avec la soit disant science promu par le GIEC et ses sous fifres tentent de promouvoir.
Batman sera toujours là pour faire régner la justice sur les topics de onche.
il y a 3 ans
C'est de la reconstitution de la température moyenne globale pour les 2 derniers millénaires et concernant l’hémisphère Nord. Sources : https://www.researchgate.[...]igh-resolution_proxy_data
et sa version pdf : file:///C:/Users/33601/Do[...]sphere_temperatures_r.pdf
également publiée dans la revue nature, et ce en 2005 par Anders Moberg, Dmitry M. Sonechkin, Karin Holmgren, Nina M. Datsenko & Wibjörn Karlén.
Source : https://www.nature.com/articles/nature03265
et sa version pdf : file:///C:/Users/33601/Do[...]sphere_temperatures_r.pdf
également publiée dans la revue nature, et ce en 2005 par Anders Moberg, Dmitry M. Sonechkin, Karin Holmgren, Nina M. Datsenko & Wibjörn Karlén.
Source :
Batman sera toujours là pour faire régner la justice sur les topics de onche.
il y a 3 ans
Anthony_Agard
3 ans
C'est de la reconstitution de la température moyenne globale pour les 2 derniers millénaires et concernant l’hémisphère Nord. Sources : https://www.researchgate.[...]igh-resolution_proxy_data
et sa version pdf : file:///C:/Users/33601/Do[...]sphere_temperatures_r.pdf
également publiée dans la revue nature, et ce en 2005 par Anders Moberg, Dmitry M. Sonechkin, Karin Holmgren, Nina M. Datsenko & Wibjörn Karlén.
Source : https://www.nature.com/articles/nature03265
et sa version pdf : file:///C:/Users/33601/Do[...]sphere_temperatures_r.pdf
également publiée dans la revue nature, et ce en 2005 par Anders Moberg, Dmitry M. Sonechkin, Karin Holmgren, Nina M. Datsenko & Wibjörn Karlén.
Source :
Batman sera toujours là pour faire régner la justice sur les topics de onche.
il y a 3 ans

En ligne
255
Sur ce sujet0