Sujet résolu
L'auteur a trouvé une solution à son problème.


Envoie des publications scientifiques qui prouvent le contraire on t'écoute

Réponse à un article de france info :  https://www.francetvinfo.[...]on-une-etude_5899427.html
De 1785 à 2015 (231 ans), la période de 21 ans la plus chaude dans la région himalayenne de l'Inde s'est produite entre 1890 et 1910.
La période 1995-2015 a été la 4ème période la plus chaude et la période 1946-1966 la 2ème période la plus chaude.
Ainsi, dans l’ensemble, la région s’est légèrement refroidie depuis 1890.
Source : https://www.researchgate.[...]on_Western_Himalaya_India
Publié dans ResearchGate
Publié dans ScienceDirect également : https://www.sciencedirect[...]abs/pii/S1040618223001751
Publié dans ResearchGate
version pdf : file:///C:/Users/33601/Do[...]nWesternHimalayaIndia.pdf
De 1785 à 2015 (231 ans), la période de 21 ans la plus chaude dans la région himalayenne de l'Inde s'est produite entre 1890 et 1910.
La période 1995-2015 a été la 4ème période la plus chaude et la période 1946-1966 la 2ème période la plus chaude.
Ainsi, dans l’ensemble, la région s’est légèrement refroidie depuis 1890.
Source :
Publié dans ResearchGate
Publié dans ScienceDirect également :
Publié dans ResearchGate
version pdf : file:///C:/Users/33601/Do[...]nWesternHimalayaIndia.pdf
Batman sera toujours là pour faire régner la justice sur les topics de onche.
il y a 2 ans
Sponsorisé
Connectez-vous pour masquer les pubsDebunked par la réalité ou des publications douteuses vu sur Facebook?
"Si mais je vois que c'est vrai" le niveau de l'argumentation bordel
"Si mais je vois que c'est vrai" le niveau de l'argumentation bordel
Publié par
Jayendra Singh
Nilendu Singh
Dr. Pankaj Chauhan
Ram Yadav
Fig. 4. Comparison of (a) March–June temperature reconstruction with (b)
Feb–June temperature reconstruction from Tons valley, Uttarakhand (Singh
and Yadav, 2014) and (c) March-April-May temperature reconstruction from
Uttarakhand (Yadav et al., 2004). Shaded blue areas represent common cool
periods. A 10 year low pass filter was applied to all temperature anomaly series
which were derived from mean and standard deviation of temperature data for
the common period (1785–2000 CE)
To understand in depth the variability and its plausible causes during
recent part, we analyzed sub-periods of our March–June temperature
record, which showed no significant temperature trend in the 20th
century (1901–2000 CE.
Batman sera toujours là pour faire régner la justice sur les topics de onche.
il y a 2 ans
Debunked par la réalité ou des publications douteuses vu sur Facebook?
"Si mais je vois que c'est vrai" le niveau de l'argumentation bordel
"Si mais je vois que c'est vrai" le niveau de l'argumentation bordel
Batman sera toujours là pour faire régner la justice sur les topics de onche.
il y a 2 ans
Debunked par la réalité ou des publications douteuses vu sur Facebook?
"Si mais je vois que c'est vrai" le niveau de l'argumentation bordel
"Si mais je vois que c'est vrai" le niveau de l'argumentation bordel
Autre étude.
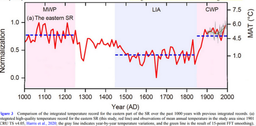
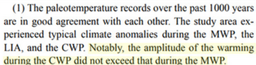
Au cours des 1000 dernières années, le long des vastes routes commerciales de la Route de la Soie de l'Eurasie, la période chaude médiévale (MWP) a été plus chaude que la période chaude actuelle (CWP).
Les symboles MWP et CWP sont utilisés de l'anglais je précise.
"l'amplitude du réchauffement lors du CWP n'a pas dépassé celle lors du MWP"
Source : https://link.springer.com[...]10.1007/s11430-022-1079-5 Publié dans Springer
Au cours des 1000 dernières années, le long des vastes routes commerciales de la Route de la Soie de l'Eurasie, la période chaude médiévale (MWP) a été plus chaude que la période chaude actuelle (CWP).
Les symboles MWP et CWP sont utilisés de l'anglais je précise.
"l'amplitude du réchauffement lors du CWP n'a pas dépassé celle lors du MWP"
Source :
Batman sera toujours là pour faire régner la justice sur les topics de onche.
il y a 2 ans
Envoie des publications scientifiques qui prouvent le contraire on t'écoute
Batman sera toujours là pour faire régner la justice sur les topics de onche.
il y a 2 ans
Debunked par la réalité ou des publications douteuses vu sur Facebook?
"Si mais je vois que c'est vrai" le niveau de l'argumentation bordel
"Si mais je vois que c'est vrai" le niveau de l'argumentation bordel
Temperature variations along the Silk Road over the past 2000 years: Integration and perspectives
Publié par Jianhui Chen, Haipeng Wang, Yan Liu, Shuai Ma et Wei Huang
Publié en 2023.
Etude 2023
Publié sur le site d'Harvard également : https://ui.adsabs.harvard[...]3ScChD..66.1468C/abstract
Ici également : https://www.x-mol.net/pap[...]ticle/1671071020036636672
Publié par Jianhui Chen, Haipeng Wang, Yan Liu, Shuai Ma et Wei Huang
Publié en 2023.
Etude 2023
Publié sur le site d'Harvard également :
Ici également :
Batman sera toujours là pour faire régner la justice sur les topics de onche.
il y a 2 ans
Debunked par la réalité ou des publications douteuses vu sur Facebook?
"Si mais je vois que c'est vrai" le niveau de l'argumentation bordel
"Si mais je vois que c'est vrai" le niveau de l'argumentation bordel
Etude 2022
Il n’y a pas eu de tendance à long terme en matière de précipitations (pluviales, sécheresse) dans le nord-est du Mexique au cours des 166 dernières années (1853 à 2018). La variabilité naturelle domine.
Des « événements hydroclimatiques extrêmes » (sécheresses) sont provoqués par ENSO tous les 2 à 4 ans.
Pour rappel, ENSO signifie El Niño-Southern Oscillation.
Source : https://www.researchgate.[...]eastern_Mexican_subtropic
Publié dans ResearchGate
Publié par Samuel Arroyo-Morales
Claudia C. Astudillo-Sánchez
Autonomous University of Tamaulipas
Oscar Alberto Aguirre Calderon
Autonomous University of Nuevo León
Jose Villanueva-Díaz
INIFAP Instituto Nacional de Investigacio
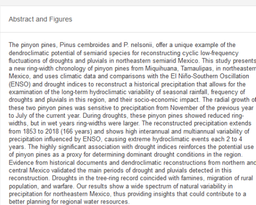
Il n’y a pas eu de tendance à long terme en matière de précipitations (pluviales, sécheresse) dans le nord-est du Mexique au cours des 166 dernières années (1853 à 2018). La variabilité naturelle domine.
Des « événements hydroclimatiques extrêmes » (sécheresses) sont provoqués par ENSO tous les 2 à 4 ans.
Pour rappel, ENSO signifie El Niño-Southern Oscillation.
Source :
Publié dans ResearchGate
Publié par Samuel Arroyo-Morales
Claudia C. Astudillo-Sánchez
Autonomous University of Tamaulipas
Oscar Alberto Aguirre Calderon
Autonomous University of Nuevo León
Jose Villanueva-Díaz
INIFAP Instituto Nacional de Investigacio
Batman sera toujours là pour faire régner la justice sur les topics de onche.
il y a 2 ans
Envoie des publications scientifiques qui prouvent le contraire on t'écoute
Publié également ici :
Et dans Springer link :
Batman sera toujours là pour faire régner la justice sur les topics de onche.
il y a 2 ans
Debunked par la réalité ou des publications douteuses vu sur Facebook?
"Si mais je vois que c'est vrai" le niveau de l'argumentation bordel
"Si mais je vois que c'est vrai" le niveau de l'argumentation bordel
D'ailleurs étrangement, certains prétendent que ceux qui sont les plus avisés concernant le climat sont parmi les plus inquiets.
En mode, : Angue gneu on est plus intelligent, on sait mieux sur le climat donc on est inquiet si nourmal olol.
Nouvelle étude 2023
Les personnes qui connaissent moins le climat et l'environnement sont plus susceptibles de ressentir de l'anxiété liée au changement climatique (« Je me retrouve à pleurer à cause du changement climatique ») et de la détresse... que celles qui connaissent mieux le climat et l'environnement.
Publié en mars 2023
Source : https://link.springer.com[...]0.1007/s10584-023-03518-z
Sur format pdf : file:///C:/Users/33601/Do[...]ds/s10584-023-03518-z.pdf
 https://osf.io/5mqjh/
En mode, : Angue gneu on est plus intelligent, on sait mieux sur le climat donc on est inquiet si nourmal olol.
Nouvelle étude 2023
Les personnes qui connaissent moins le climat et l'environnement sont plus susceptibles de ressentir de l'anxiété liée au changement climatique (« Je me retrouve à pleurer à cause du changement climatique ») et de la détresse... que celles qui connaissent mieux le climat et l'environnement.
Publié en mars 2023
Source :
Sur format pdf : file:///C:/Users/33601/Do[...]ds/s10584-023-03518-z.pdf
Batman sera toujours là pour faire régner la justice sur les topics de onche.
il y a 2 ans
Envoie des publications scientifiques qui prouvent le contraire on t'écoute
Batman sera toujours là pour faire régner la justice sur les topics de onche.
il y a 2 ans
Sponsorisé
Connectez-vous pour masquer les pubsEnvoie des publications scientifiques qui prouvent le contraire on t'écoute
Results showed that, even after controlling for demographic characteristics, personality
characteristics, and environmental attitudes, overall environmental knowledge and climate-
specific knowledge were negatively related to climate change anxiety
“The degree of one’s emotions varies inversely with one’s knowledge of the facts,
the less you know the hotter you get.”
Time lagged data were collected from a large sample in Germany at four time points across
three months (i.e., Time [T] 1 = August, T2 = September, T3 = October, and T4 = November
of 2022). The time lags help reduce the potential problem of common method bias and allow
drawing stronger inferences regarding the assumed temporal ordering of variables. Collecting
constructs at different time points was also necessary to reduce the length of each survey. Par-
ticipants were recruited by an ISO 26362 certified professional online panel company. At T1,
participants provided information on demographic characteristics and environmental attitudes
as control variables. At T3, participants took an environmental knowledge test (n.b., no data
collected at Time 2 is used in the current study). Finally, at T4, participants reported their cli-
mate change anxiety, as well as the Big Five personality characteristics as control variables.
A sample of 2,066 employed adults in Germany participated in this study. The sample
was 50.39% female and on average 47.07 years of age (SD= 12.18, range 18–85 years).
Most participants (43.47%) held a college/university or technical college degree. The sam-
ple was not representative of the general population, as it did not include children, retir-
ees, and unemployed people. The sample was also older and more highly educated than
the working population in Germany (i.e., average age of 44 years, 24% college/university
degree). Further information on the sample (e.g., income, industry) is available in Table S1
in the online supplemental materials (OSM; https://osf/. io/5mqjh).
The first survey was initiated by 3,566 people. Sample sizes for observed variables var-
ied by time point (T1: 3,256—3,562; T3: 2,350—2,353; T4: 2,336—2,337), suggesting
some degree of attrition over time and some degree of missingness within each time point.
Our analyses are based on a sample of 2,066 individuals who provided complete data on
our substantive and control variables across all time points. Table S1 compares these com-
plete responders to incomplete responders (n = 1,500). We also ran a logistic regression
model showing that T1 demographics predicted less than 2% of the variance in attrition,
suggesting that bias due to attrition was not a significant concern. Complete data and R
code to reproduce the analyses reported in this paper can be found in the OSM
characteristics, and environmental attitudes, overall environmental knowledge and climate-
specific knowledge were negatively related to climate change anxiety
“The degree of one’s emotions varies inversely with one’s knowledge of the facts,
the less you know the hotter you get.”
Time lagged data were collected from a large sample in Germany at four time points across
three months (i.e., Time [T] 1 = August, T2 = September, T3 = October, and T4 = November
of 2022). The time lags help reduce the potential problem of common method bias and allow
drawing stronger inferences regarding the assumed temporal ordering of variables. Collecting
constructs at different time points was also necessary to reduce the length of each survey. Par-
ticipants were recruited by an ISO 26362 certified professional online panel company. At T1,
participants provided information on demographic characteristics and environmental attitudes
as control variables. At T3, participants took an environmental knowledge test (n.b., no data
collected at Time 2 is used in the current study). Finally, at T4, participants reported their cli-
mate change anxiety, as well as the Big Five personality characteristics as control variables.
A sample of 2,066 employed adults in Germany participated in this study. The sample
was 50.39% female and on average 47.07 years of age (SD= 12.18, range 18–85 years).
Most participants (43.47%) held a college/university or technical college degree. The sam-
ple was not representative of the general population, as it did not include children, retir-
ees, and unemployed people. The sample was also older and more highly educated than
the working population in Germany (i.e., average age of 44 years, 24% college/university
degree). Further information on the sample (e.g., income, industry) is available in Table S1
in the online supplemental materials (OSM;
The first survey was initiated by 3,566 people. Sample sizes for observed variables var-
ied by time point (T1: 3,256—3,562; T3: 2,350—2,353; T4: 2,336—2,337), suggesting
some degree of attrition over time and some degree of missingness within each time point.
Our analyses are based on a sample of 2,066 individuals who provided complete data on
our substantive and control variables across all time points. Table S1 compares these com-
plete responders to incomplete responders (n = 1,500). We also ran a logistic regression
model showing that T1 demographics predicted less than 2% of the variance in attrition,
suggesting that bias due to attrition was not a significant concern. Complete data and R
code to reproduce the analyses reported in this paper can be found in the OSM
Batman sera toujours là pour faire régner la justice sur les topics de onche.
il y a 2 ans
Debunked par la réalité ou des publications douteuses vu sur Facebook?
"Si mais je vois que c'est vrai" le niveau de l'argumentation bordel
"Si mais je vois que c'est vrai" le niveau de l'argumentation bordel
Des températures si insolites que ça en Iran?
Nouvelle étude 2023 :
Les températures reconstituées en Iran correspondent bien aux températures « réelles » des dernières décennies (1976-2014).
Et lorsque le record de température reconstitué est étendu jusqu’à 1 657, la tendance à long terme ne montre aucun réchauffement au cours des 357 dernières années.
Source :
Batman sera toujours là pour faire régner la justice sur les topics de onche.
il y a 2 ans
Envoie des publications scientifiques qui prouvent le contraire on t'écoute
Publié par : M Alipoorfard 1 K Pourtahmasi 2 M Raeini Sarjaz 3 M Nadi 4
1 MSc. Graduated of Agrometeorology, Dept. of water engineering, Faculty of Agricultural Engineering, Sari Agricultural sciences and Natural Resources University, Sari, I. R. Iran
2 Prof., Dept. of Wood and Paper Science and Technology, Faculty of Natural Resources, University of Tehran, Karaj, I. R. Iran
3 Prof., Dept. of water engineering, Faculty of Agricultural Engineering, Sari Agricultural sciences and Natural Resources University, Sari, I. R. Iran
4 4Assistant Prof., Dept. of water engineering, Faculty of Agricultural Engineering, Sari Agricultural sciences and Natural Resources University, Sari, I. R. Iran
" The study of temperature fluctuations is essential for agricultural planning and environmental studies. With global warming affecting various regions, access to long-term temperature data is becoming increasingly important. Dendroclimatology is a useful tool for long-term climate study, and in this study, the average habitat temperature was reconstructed after developing the chronology of Juniperus polycarpus trees in Keygoran site (Aligodarz, Lorestan). The correlation of annual tree rings with climatic variables of meteorological stations was investigated to reconstruct the average temperature in January-March for the period 1910-2014 for this region. The findings show a positive and significant correlation between the average January-March temperature and the growth of annual tree rings. The results show the occurrence of cold years in the first years of the 1910s to the first half of the 1960s. Warm periods have occurred since the second half of the 1960s, and the temperature trend has generally been increasing in recent years. An examination of the positive and negative pointer years also shows that most of the positive pointer years occurred in the second half of the twentieth century. "
Batman sera toujours là pour faire régner la justice sur les topics de onche.
il y a 2 ans
Envoie des publications scientifiques qui prouvent le contraire on t'écoute
Batman sera toujours là pour faire régner la justice sur les topics de onche.
il y a 2 ans
Envoie des publications scientifiques qui prouvent le contraire on t'écoute
Des inondations qui s'aggravent dans le cadre d'une augmentation de température et de changement climatique?
À l’échelle mondiale, l’ampleur des inondations diminue à mesure que les températures augmentent.
"Nous constatons que la plupart des régions du monde présentent une diminution des volumes d'inondations avec l'augmentation des températures."
Source :
Publié dans ScienceDirect par Wei He, Seokhyeon Kim, Conrad Wasko et Ashish Sharma
Batman sera toujours là pour faire régner la justice sur les topics de onche.
il y a 2 ans
Envoie des publications scientifiques qui prouvent le contraire on t'écoute
Batman sera toujours là pour faire régner la justice sur les topics de onche.
il y a 2 ans
Envoie des publications scientifiques qui prouvent le contraire on t'écoute
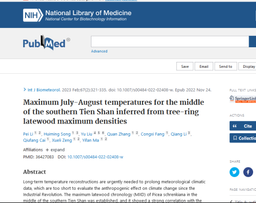
Les données MXD (cernes des arbres) sont fortement corrélées (r = 0,77) avec la période 1959-2016 max. (juillet-août) temps.
En évaluant les températures de 1 720 à 2018, les données MXD montrent un refroidissement depuis 1900 (environ 1 °C de plus dans les années 1920-1930).
Ces tendances sont observées dans « plusieurs… régions du monde ».
Source : https://link.springer.com[...]0.1007/s00484-022-02408-w
Publié dans Springer link
Publié en novembre 2022 par
Pei Li , Huiming Song , Yu Liu , Quan Zhang , Congxi Fang , Qiang Li , Qiufang Cai , Xueli Zeng 1 , Yifan Ma
En évaluant les températures de 1 720 à 2018, les données MXD montrent un refroidissement depuis 1900 (environ 1 °C de plus dans les années 1920-1930).
Ces tendances sont observées dans « plusieurs… régions du monde ».
Source :
Publié dans Springer link
Publié en novembre 2022 par
Pei Li , Huiming Song , Yu Liu , Quan Zhang , Congxi Fang , Qiang Li , Qiufang Cai , Xueli Zeng 1 , Yifan Ma
Batman sera toujours là pour faire régner la justice sur les topics de onche.
il y a 2 ans
Envoie des publications scientifiques qui prouvent le contraire on t'écoute
Batman sera toujours là pour faire régner la justice sur les topics de onche.
il y a 2 ans
Envoie des publications scientifiques qui prouvent le contraire on t'écoute
Etude qui a été publiée en 2022
Egalement : https://pubmed.ncbi.nlm.nih.gov/36427083/
Publié dans Dans le National Library of Medicine.
Egalement :
Publié dans Dans le National Library of Medicine.
Batman sera toujours là pour faire régner la justice sur les topics de onche.
il y a 2 ans
Envoie des publications scientifiques qui prouvent le contraire on t'écoute
References
Adams JB, Mann ME, Ammann CM (2003) Proxy evidence for an EI Niño-like response to volcanic forcing. Nature 426:274–278. https://doi.org/10.1038/nature02101 - DOI
Berkelhammer M, Stott LD (2012) Secular temperature trends for the southern Rocky Mountains over the last five centuries. Geophys Res Lett 39:17701–17706. https://doi.org/10.1029/2012GL052447 - DOI
Björklund J, Seftigen K, Schweingruber F, Fonti P, von Arx G, Bryukhanova MV, Cuny HE, Carrer M, Castagneri D, Frank DC (2017) Cell size and wall dimensions drive distinct variability of earlywood and latewood density in Northern Hemisphere conifers. New Phytol 216:728–740. https://doi.org/10.1111/nph.14639 - DOI
Bothe O, Fraedrich K, Zhu XH (2012) Precipitation climate of Central Asia and the large-scale atmospheric circulation. Theoret Appl Climatol 108:345–354. https://doi.org/10.1007/s00704-011-0537-2 - DOI
Briffa KR, Shishov VV, Melvin TM, Vaganov EA, Grudd H, Hantemirov RM, Eronen M, Naurzbaev MM (2008) Trends in recent temperature and radial tree growth spanning 2000 years across northwest Eurasia. Philos Trans R Soc 363:2269–2282. https://doi.org/10.1098/rstb.2007.2199 - DOI
Adams JB, Mann ME, Ammann CM (2003) Proxy evidence for an EI Niño-like response to volcanic forcing. Nature 426:274–278.
Berkelhammer M, Stott LD (2012) Secular temperature trends for the southern Rocky Mountains over the last five centuries. Geophys Res Lett 39:17701–17706.
Björklund J, Seftigen K, Schweingruber F, Fonti P, von Arx G, Bryukhanova MV, Cuny HE, Carrer M, Castagneri D, Frank DC (2017) Cell size and wall dimensions drive distinct variability of earlywood and latewood density in Northern Hemisphere conifers. New Phytol 216:728–740.
Bothe O, Fraedrich K, Zhu XH (2012) Precipitation climate of Central Asia and the large-scale atmospheric circulation. Theoret Appl Climatol 108:345–354.
Briffa KR, Shishov VV, Melvin TM, Vaganov EA, Grudd H, Hantemirov RM, Eronen M, Naurzbaev MM (2008) Trends in recent temperature and radial tree growth spanning 2000 years across northwest Eurasia. Philos Trans R Soc 363:2269–2282.
Batman sera toujours là pour faire régner la justice sur les topics de onche.
il y a 2 ans

En ligne
121
Sur ce sujet0